Explore the Toolkit
Made with Numerro
Pricing & Sign Up
Learn
Go To Member's Hub
Login
Try it Free
Process Guide
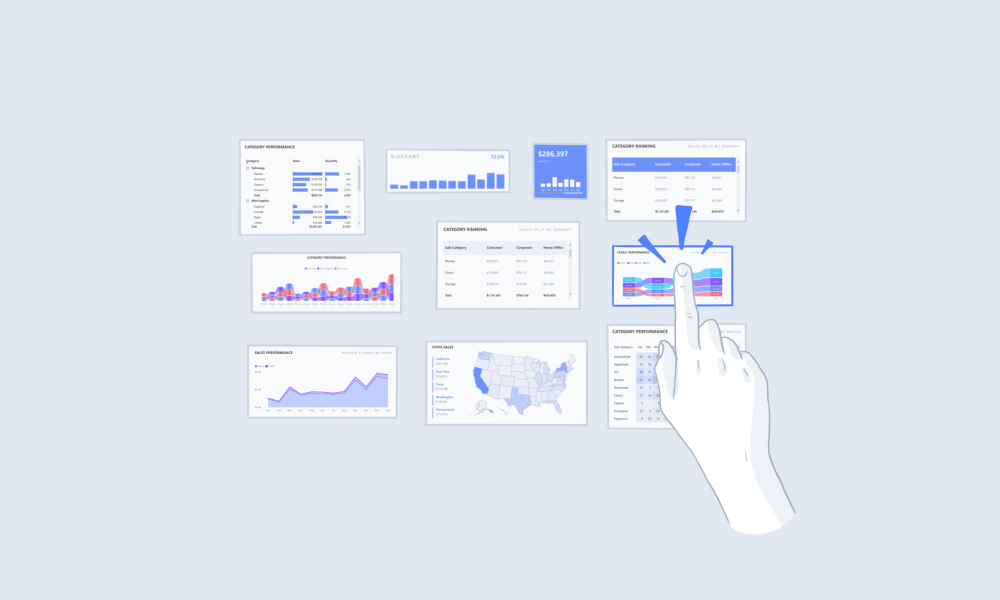
Choose Your Visuals
Choose appropriate visuals for your Power BI dashboard.
Summary
Choose your
Power BI visuals
based on the type of insight as follows:
Comparison
-
Bar Chart
,
Grouped Bar
,
Line Chart
,
Bubble Chart
,
Area Chart
, Stacked Bar,
Ribbon
,
Shape Map
,
Donut
,
Treemap
Data Over Time
-
Bar Chart
,
Line Chart
, Stacked Bar,
Area Chart
, Stacked Area,
Bubble Chart
,
Waterfall
Correlation
-
Bubble Chart
, Column Line,
Scatterplot
Distribution
-
Bubble Chart
, Grouped Bar
Part-to-Whole
-
Donut
, Stacked Bar,
Treemap
Ranking
-
Ordered Column
,
Ordered Bar
,
Ribbon
, Decomposition Tree, Funnel
Additional Tips
Working with Text
Using Subheadings
Enhancing Report Performance
Reduce Visual Components
Working with Text
Subtle Call To Actions
Suggested Guides
Handbook
Top 10 Power BI Dashboard Examples + Free Template
Handbook
The Complete Guide to Designing Power BI Reports
Handbook
The Complete Guide to Power BI Visuals + Custom Visuals
Suggested Blog Posts
Dashboard Design
Power BI Dashboard Design Best Practice
Dashboard Design
Designing Power BI Dashboards in Dark Mode
Dashboard Design
Basics of Building a Power BI Dashboard
Ready to improve your reports?
Get free access today.
View Pricing
Try It Free


.png)


.png)