Explore the Toolkit
Made with Numerro
Pricing & Sign Up
Learn
Go To Member's Hub
Login
Try it Free
Process Guide
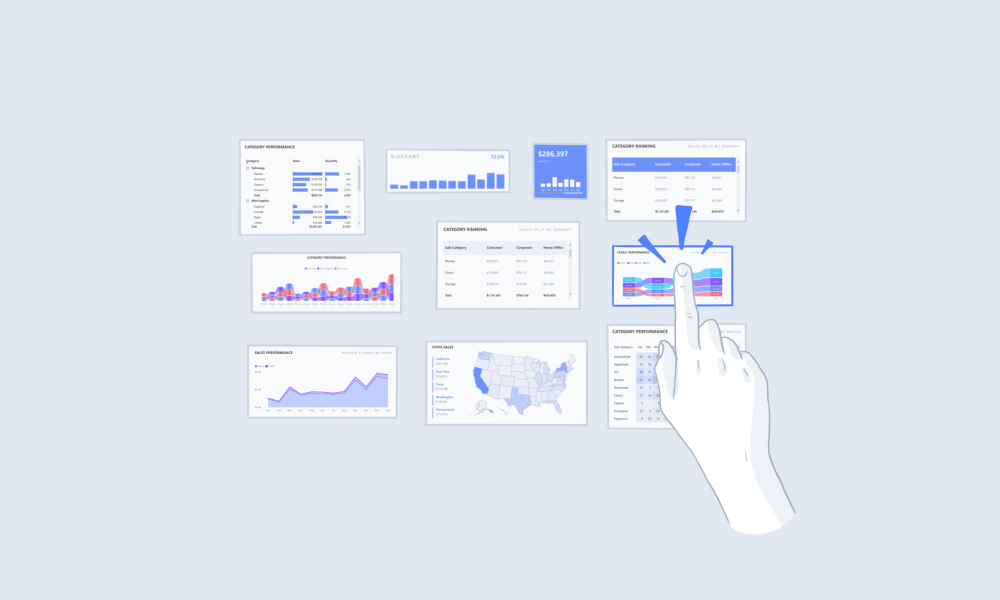
Choose Your Layout
Follow a logical layout for visual clarity in your Power BI dashboard.
Summary
Use a logical layout for you
Power BI dashboard
by positioning:
High-level visuals at the top
Trend-based visuals in the middle
Granular visuals at the bottom
Additional Tips
Using Visuals
Not All Visuals Are Equal
Process Guide
Steps to Building a Report
External Tools in Power BI Desktop
Adding Numerro as an External Tool in Power BI Desktop
Suggested Guides
Handbook
The Complete Guide to Power BI Visuals + Custom Visuals
Handbook
Top 10 Power BI Dashboard Examples + Free Template
Handbook
The Complete Guide to Designing a BI Dashboard Mockup
Suggested Blog Posts
Embedded Analytics
Examples of Basic & Advanced Embedded Analytics
Data Visualisation
More Themes for Design Inspiration
Data Analytics
How Your Company Can Benefit From a Data Driven Culture
Ready to improve your reports?
Get free access today.
View Pricing
Try It Free


.png)


.png)