

Goal setting is essential to ensure teams are accurately tracking progress against business objectives. When a team’s performance is measured against a unified metric, employees have a clear target at which to aim their day-to-day workloads and, when this goal is met, they also have a definitive reason to celebrate success. Still, it can be difficult to clearly measure and maintain a team’s performance against an objective. In this blog, we will explore how Power BI’s scorecards and metric visuals can help teams track key business metrics in a centralized report.
A scorecard allows a team to visualize their progress toward key performance indicators (KPIs). Scorecards combine goals from various teams and departments into a visualization that allows organizations to view performance across multiple objectives in a centralized location.
While a data analytics dashboard can contain many different visualizations that track various details on an organization’s KPIs, a scorecard combines a multitude of goal metrics into a single report that can help businesses quickly identify problematic areas and re-strategize where necessary.

While any metric can be added to a Power BI scorecard, we recommend using metrics that measure progress toward a tangible target. These metrics will vary by department. The scorecard pictured above tracks a sales department’s goals. The team has overarching revenue and sales pipeline goals, with smaller objectives that help the team progress toward these targets. While these types of rollup goals are not required in a scorecard, they do help break down and visualize the components that help a team achieve their ultimate objectives.
The Power BI scorecard visual indicates whether or not a goal is on track or at risk—allowing teams to quickly redirect their focus to objectives that are falling behind. Additionally, Power BI scorecards are easy to share throughout a team or organization. They can be shared with individuals or teams directly, or a link to the scorecard can be copied to share with the broader organization. This provides visibility, encourages transparency, and can lead to increased productivity given that an entire team or organization has an awareness of lagging goals and can work together to develop a plan that can course-correct trailing metrics before it’s too late.
Scorecards are also extremely useful in business meetings with an individual team or an entire organization. In standing team meetings, scorecards should be presented to ensure everyone understands how the team is progressing toward key objectives and that there is a plan in place to modify the team’s approach toward underperforming goals. At company-wide meetings, scorecards are also a great way to present the organization’s progress toward the company’s overarching KPIs. This helps individual teams understand how their work directly impacts company-wide objectives and can inspire productivity as well as a renewed sense of purpose in an individual employee’s day-to-day work.
To create a scorecard in Microsoft Power BI Service, navigate to the Metrics hub in Power BI’s main left-hand navigation panel:


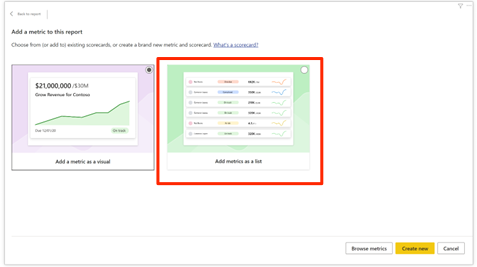
To create a scorecard in Power BI Desktop, you can also leverage the metrics visual to establish the metrics that will be used in your scorecard.
Metrics visuals can be thought of as the individual goals you would like to track. Scorecards are a way to group these metrics together. To establish metrics:


An individual metric can show progress toward a goal without being used in a scorecard. The metrics visual allows users to create an individual visualization for a goal with various visualization options that help end users easily evaluate progress toward a specific goal.


Metrics visuals offer additional flexibility—allowing a single metric to be shared with members of your organization as opposed to sharing an entire scorecard. Additionally, team members can ‘follow’ an individual metric of interest and receive notifications when a metric is updated. While scorecards are a great way to track progress across all goals on a team, individual metrics visuals can help a team dive further into a specific goal and easily identify trends over time.
Power BI scorecards are a great way for teams to track progress and stay on target with key objectives. Additionally, individual metrics visuals can help a team visualize and dive further into their progress toward a single goal. Leveraging both scorecards and metrics visuals can help improve team collaboration, encourage productivity, and provide visibility into team performance. Microsoft Power BI’s scorecard visualization options make it easy to track, update and share your team’s progress toward key business objectives.


.png)